Designing real-time analytics with ClickHouse
Design ClickHouse real-time analytics with event schemas, tenant scope, query performance, aggregation, freshness, and late-event handling.
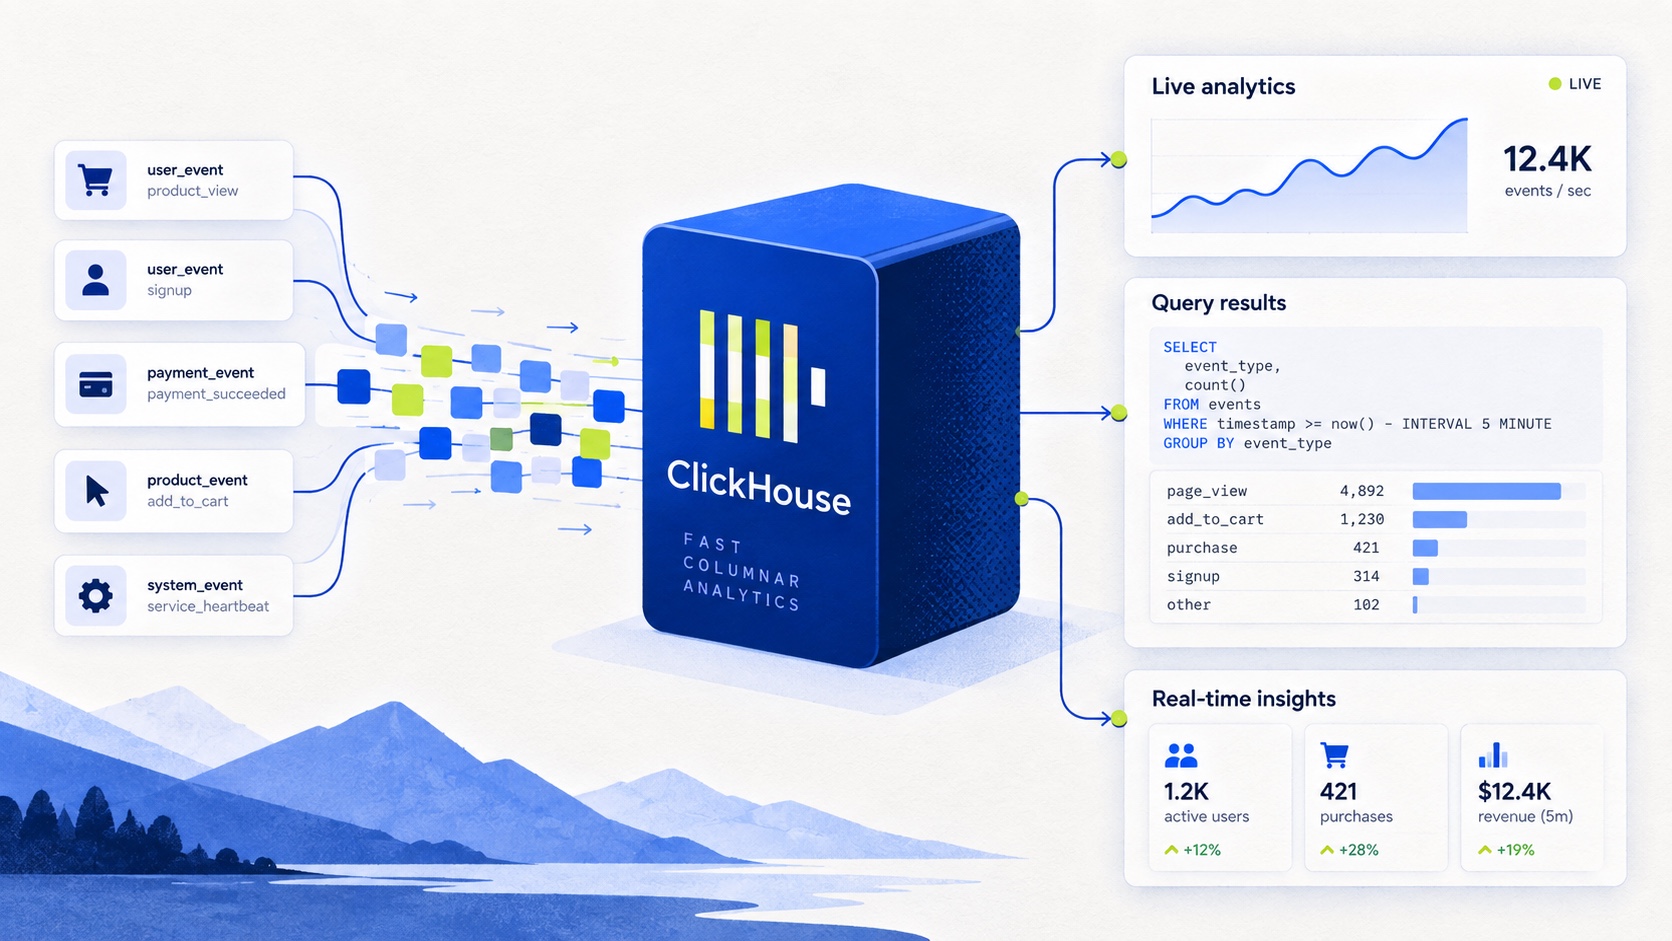
Real-time analytics is often introduced as a query-speed problem. The product wants a chart to update quickly, so the team chooses a fast analytical database and starts optimizing SQL.
That is only one part of the system.
An analytics answer is shaped by the event model, ingestion path, tenant boundary, source context, time semantics, aggregation strategy, and user expectation about freshness. A query can be extremely fast and still be wrong because it counted the wrong population, used an incomplete time window, or returned data that the interface presented as current when the pipeline was still processing.
ClickHouse is a powerful part of that design, especially for high-volume event data. But the database does not decide what an event means or which filters belong together. Those decisions have to remain explicit from the product surface to the query builder.
Real-time is a product contract
Before choosing a storage pattern, define what real-time means for the product.
It may mean:
- a new event is queryable within a few seconds;
- a dashboard refreshes without a page reload;
- a report reflects the latest completed aggregation window;
- a user can see that a recent action is still being processed;
- or a stream is available for operational monitoring rather than historical reporting.
These are not interchangeable promises. A system can ingest events quickly while a derived report remains delayed. It can serve fresh raw events while a materialized aggregate catches up later. If the interface uses one vague word, users will fill in the missing contract themselves.
I prefer to name freshness in the data model and in the UI. A report should be able to distinguish current, delayed, partial, and unavailable data. That distinction is as important as the query latency.
Start with an event that can survive change
An event table is not just a collection of properties. It is a record of something that happened, in a context that gives the record meaning.
A useful baseline often includes:
- an event timestamp and an ingestion timestamp;
- a stable event name;
- tenant and source identifiers;
- a session or visitor identifier when the product supports that concept;
- a version or schema marker;
- a set of event properties;
- enough identifiers to trace ingestion without exposing sensitive payloads.
The difference between event time and ingestion time matters. An event can arrive late, be replayed, or be backfilled. If the query uses only ingestion time, the report may answer when the system received the event rather than when the user action occurred.
The event name also needs a contract. A string such as purchase is not meaningful by itself if different sources define it differently. Source context, tenant context, and event version prevent a convenient name from becoming an ambiguous fact.
Choose the table order around the questions
ClickHouse does not behave like a transactional row store with a generic index added afterward. The table’s ordering strategy is part of query design.
A simplified table might look like this:
CREATE TABLE events
(
    tenant_id UUID,
    source_id UUID,
    event_name LowCardinality(String),
    event_time DateTime64(3),
    ingestion_time DateTime64(3),
    session_id String,
    properties Map(String, String)
)
ENGINE = MergeTree
PARTITION BY toYYYYMM(event_time)
ORDER BY (tenant_id, source_id, event_time, event_name);
This is not a universal schema. It illustrates the decision: the order should help the database narrow the data for the filters the product uses most often.
If almost every query is scoped by tenant and source, those boundaries should be treated as first-class query inputs. If the main report scans a time range, time belongs in the access path. If the system mostly groups by event name after applying the scope, that should influence the design as well.
The correct order depends on workload. A schema copied from another analytics product can be technically valid and still make the important queries expensive.
Partitions are lifecycle boundaries
Partitioning is useful for data management and pruning, but it is not a replacement for a query model.
I think of a partition as a lifecycle decision: which records are likely to be retained, moved, compacted, or removed together? A monthly partition may be convenient for retention and backfills. A daily partition may make operational workflows easier for a high-volume stream. A very granular partitioning scheme can create too many parts and make the system harder to maintain.
Partitioning should not be chosen only because a query filters on the same field. The ordering key usually does more of the work for selective reads. Partitioning should support retention and operational behavior without creating unnecessary fragmentation.
Scope is part of correctness
Analytics filters are authorization and meaning boundaries, not just UI controls.
The same event name can represent different behavior in different sources. The same visitor identifier can have different interpretation rules across tenants. A date range can be based on event time, ingestion time, or a product-defined reporting timezone.
That means a query builder should not accept an unstructured bag of filters and concatenate whatever values it receives. It should construct a validated scope first, then use a shared set of predicates for every query that answers the same question.
For example, a funnel breakdown, its summary count, and its pagination query should agree on:
- tenant and source boundaries;
- event-time range;
- attribution or consent mode;
- population definition;
- event-name allowlists;
- and any report-specific constraints.
If the list query and count query use slightly different predicates, the interface becomes internally inconsistent even when both SQL statements are individually fast.
Keep dynamic SQL safe and predictable
Analytics products often need dynamic filters, sorting, and dimensions. That does not mean the query should be assembled from arbitrary user-provided fragments.
I prefer a small allowlist for dynamic identifiers and typed handling for values. Sort fields, grouping dimensions, and supported event properties should come from application constants or a validated schema. String values should be escaped or passed through the database driver’s parameter mechanism where available. A user-controlled value should never become a column name or a piece of SQL syntax by accident.
The allowlist also protects performance. If every possible property can become a grouping dimension, the product has effectively promised a query planner for an unlimited data model. Supported dimensions make the experience more predictable and the testing surface smaller.
Aggregation is a product decision
The fastest query is not always the best query. It may be fast because it returns an approximation, excludes late events, or uses a precomputed state that has not caught up with the latest raw data.
Before choosing an aggregate, define what users need to trust:
- exact counts or directional trends;
- unique people or unique sessions;
- first-touch or last-touch attribution;
- event occurrence or conversion completion;
- current totals or a reproducible historical snapshot.
The distinction between count, unique counts, and distinct session behavior can change the story the dashboard tells. A product should expose that semantic choice instead of hiding it behind a chart label.
Pre-aggregation can be valuable when many users ask the same expensive question. Materialized views or rollup tables can reduce repeated work, but they introduce a freshness path that must be monitored. The raw event table remains the reference for validation and backfills.
The optimization is successful only if the product can explain when the aggregate is complete and how it relates to the source events.
Treat late and duplicate events as normal
Event pipelines receive retries, delayed requests, client reconnects, replays, and backfills. Designing as if every event arrives once and in order creates fragile analytics.
The system needs a policy for duplicates. That policy may use an event identifier, a source-generated key, a deduplication window, or a documented tolerance for repeated records. It also needs a policy for late events: should a historical report change when an event arrives two days late, and if so, how is that change communicated?
Idempotent ingestion is valuable, but it does not make every downstream calculation automatically correct. A derived table may need to be recomputed or corrected when historical inputs change. Backfills should be observable and should record the affected reporting window.
The honest design is not the one that pretends the stream is perfect. It is the one that makes imperfect delivery visible and recoverable.
Separate freshness from availability
An analytical endpoint can return HTTP success while still delivering an answer that is incomplete for the user’s question. The response should carry enough information for the interface to distinguish:
- data is complete for the requested range;
- data is available but still processing;
- part of the range is delayed;
- the source has no data;
- or the query failed.
This can be represented with metadata such as the last processed event time, the requested range, and a freshness state. It prevents the UI from inferring freshness from a successful request alone.
The same metadata helps operators. If an ingestion pipeline stops at 14:05 while queries continue returning 200 responses, the system should make that gap visible rather than reporting a healthy-looking but stale dashboard.
Make query performance explainable
An average query duration is a weak diagnostic. I want to know what the query scanned, which scope it used, whether it hit a pre-aggregation, how many groups it produced, and whether the request was a first load or an interactive refinement.
Useful dimensions include:
- tenant and source class, without logging sensitive identifiers unnecessarily;
- time-range size;
- report type and selected dimensions;
- raw versus aggregated path;
- rows or parts read;
- cache state;
- and freshness state.
The goal is not to record every detail forever. It is to make the expensive path identifiable. A query that is fine for one day becomes a problem for one year. A breakdown with one dimension becomes a different problem with three. Performance data should preserve those differences.
Build the API around a stable question
The frontend should not need to know how the database is laid out. The API should expose a stable question and a typed scope, then translate that request into the appropriate query path.
For example, the request might express:
{
  "range": { "from": "2026-08-01", "to": "2026-08-31" },
  "sourceId": "...",
  "metric": "conversion_rate",
  "breakdown": "country"
}
The server still needs to validate whether country is supported for that metric, whether the caller can access the source, and whether the requested range is within a safe limit. It can then choose a raw query, a rollup, or a cached result without leaking those implementation details to the client.
Stable questions make the system easier to evolve. The underlying table can change while the meaning of the report remains explicit.
The practical meaning of real-time
Real-time analytics is the combination of a fast enough query, a reliable ingestion path, a clear event model, and a product that communicates freshness honestly.
ClickHouse can make high-volume analytical queries feel immediate, but the database is only one part of the trust chain. The application still needs explicit tenant and source scope. The query builder still needs safe allowlists. Aggregates still need a freshness contract. Late events still need a recovery path. List and count endpoints still need identical predicates.
When those pieces agree, performance becomes more than a benchmark. A user can ask a question, see an answer, understand how current it is, and make a decision without wondering whether the system quietly changed the rules.
That is the standard I want from real-time analytics: not merely data that arrives quickly, but data whose meaning remains stable while it moves.