The first question most teams ask about AI-assisted engineering is usually the least useful one:
How much more productive are we now?
It sounds measurable. It is not a single measurement. A team can merge more pull requests while creating more rework. It can accept more generated code while spending longer in review. It can reduce the time needed to write a first draft while increasing the cost of debugging an incorrect one.
AI-assisted engineering is a system of work, not a speedometer.
The useful question is whether assistance helps a team produce better outcomes with a sustainable amount of effort. That requires several signals, a clear comparison period, and enough evidence to explain why a metric moved.
Separate adoption from impact
An AI tool produces many activity metrics:
- active users;
- prompts or sessions;
- accepted suggestions;
- generated lines of code;
- tool calls;
- time spent with the assistant.
These metrics can tell you whether the tool is being used and where trust or friction may exist. They do not prove that the engineering system improved.
The distinction is important. Google Cloud’s DORA guidance makes a similar separation between AI-assistance measures and development productivity or business impact: adoption and trust are useful stages, but they should not be mistaken for the final outcome.
I use four layers:
| Layer | What it helps answer | Example signals |
|---|---|---|
| Adoption | Is the capability being used? | Active teams, sessions, enabled repositories |
| Trust | Do developers accept and verify the assistance? | Review changes, rejected suggestions, reported issues |
| Flow | Is work moving through the delivery system? | Lead time, deployment frequency, time to review |
| Outcome | Did the product and team get better? | Defects, incidents, rework, user value, developer friction |
The layers are connected but not interchangeable. A high acceptance rate can coexist with a high escaped-defect rate. A low adoption rate can be a sign of poor fit rather than resistance to change.
Measure the work around the model
An AI-assisted session is not the outcome. It is one part of a longer path:
prompt → context → generated change → human review → tests → merge → release → resultThe measurement model should follow that path. If telemetry stops at the generated diff, the team can see activity but not retained value. If it starts only at the merged pull request, it misses the cost of prompting, correction, review, and failed attempts.
A practical event record might include:
type AssistedWork = {
  sessionId: string
  repositoryId: string
  workType: "feature" | "bug" | "maintenance" | "docs"
  assistanceMode: "suggestion" | "chat" | "agent"
  reviewOutcome: "accepted" | "modified" | "rejected"
  changeId?: string
  evidence: string[]
}
The point is not to create a perfect ledger of human thought. It is to preserve enough context to connect assistance to the work that followed. A small, privacy-conscious trace is more useful than a large collection of unstructured prompts that nobody can interpret.
Use a balanced scorecard, not a magic number
There is a temptation to combine every signal into one AI productivity score. That makes a dashboard look decisive and makes trade-offs harder to see.
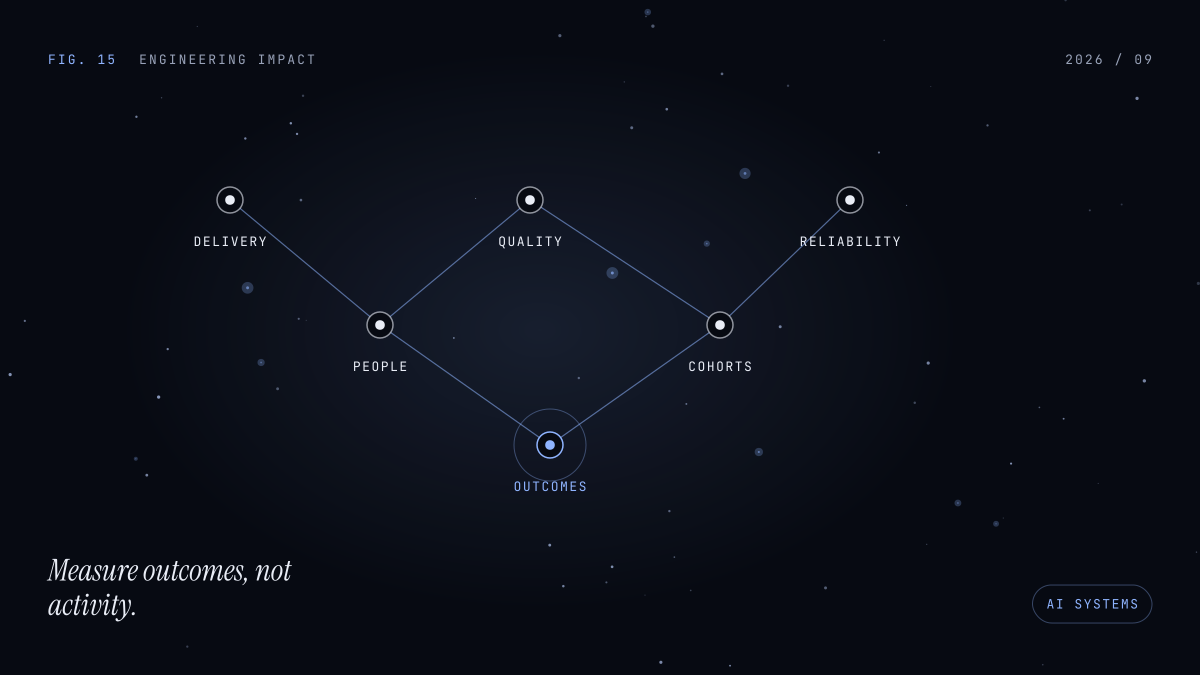
I prefer a small scorecard with separate dimensions:
Delivery
Measure how quickly useful work moves from an accepted change to production. Lead time and deployment frequency can show flow, but they need to be read alongside change failure and recovery signals.
Quality and rework
Track defects, rollback or hotfix activity, review churn, and changes that had to be substantially rewritten. “Accepted” is not the same as “retained.” A generated contribution that survives review and a release is different from one that is deleted two days later.
Reliability
Look at incidents, regression patterns, alert noise, and operational load. If AI makes code easier to produce but harder to operate, the system has not improved in the way users experience it.
Developer experience
Ask whether the tool reduces or adds friction. Short surveys can capture confidence, cognitive load, context switching, and time spent correcting the assistant. These are not soft extras. They explain why the delivery metrics moved.
Cost and capacity
Include model spend, infrastructure cost, review time, and the engineering capacity reclaimed from repetitive work. A cheaper model that creates more verification work may not be the cheaper path.
Product outcome
Connect engineering changes to a product measure when one exists: task completion, conversion, support volume, retention, or another meaningful result. Not every engineering change has a direct product metric, but a measurement program should not stop at code output.
Compare like with like
Before measuring impact, define the comparison. A team adopting an assistant during a migration, incident, or reorganization cannot interpret a before-and-after chart as a clean experiment.
Useful controls include:
- compare the same repository and work types across similar periods;
- separate feature work from maintenance and incident response;
- record release risk, platform changes, and staffing changes;
- compare teams only when their workflows and constraints are reasonably similar;
- use a baseline long enough to smooth out one unusual sprint;
- look for changes in distributions, not only averages.
The goal is not to prove that AI caused every improvement. It is to avoid claiming causation when the evidence only shows correlation.
This is also where engineering intelligence products such as Span fit into the conversation. Span describes an approach that connects AI agent traces with code, pull requests, delivery, quality, cost, and work context. That is a more useful shape than a standalone score because it lets a team inspect the evidence behind a conclusion. The tool still does not remove the need for a measurement design: a connected data model can make a weak question easier to query.
Protect people while collecting evidence
Engineering telemetry can become surveillance if its scope is not explicit. The purpose should be to improve systems and workflows, not to rank individual developers by raw activity.
Set boundaries before collecting data:
- aggregate by team, repository, or workflow where individual detail is not needed;
- redact secrets and personal data before storage;
- avoid recording unrelated terminal, browser, or keystroke activity;
- explain what is collected, why it is collected, and who can access it;
- keep source traces available only for the review or debugging purpose that requires them;
- do not use generated-line counts as a proxy for individual performance.
The safest signal is the smallest one that answers the decision. If the question is whether a repository needs better test scaffolding, a team-level pattern may be enough. Storing every prompt is not automatically better evidence.
Turn the dashboard into a learning loop
A measurement program should end in an action, not a ranking.
When rework increases, inspect context quality, tool friction, and review practices. When delivery improves but reliability worsens, invest in tests, release controls, or smaller changes. When adoption is low, find out whether the assistant is poorly integrated or the tasks are a bad fit.
A useful operating rhythm is:
- Choose one workflow and one decision to improve.
- Define the baseline and the guardrail metrics.
- Collect only the context needed to connect assistance to outcomes.
- Review the evidence with engineers who did the work.
- Change the workflow, not only the model.
- Re-measure after the system has had time to settle.
The best result may not be a higher activity number. It may be fewer regressions, a faster recovery, clearer ownership, or more time for difficult product work.
Measure leverage, not motion
AI-assisted engineering deserves better measurement than a leaderboard. The important evidence is distributed across the work: what was attempted, what survived review, what reached users, what failed, and what the team learned.
If a single score hides those trade-offs, it is not simplifying the system. It is removing the explanation.
Measure the trace, keep quality and human experience visible, and use the results to improve the environment around the model.
Further reading: DORA’s ROI of AI-assisted Software Development, Google Research on human-centered developer productivity, and Span’s engineering intelligence overview.